
As per Forbes, it is assumed that 24% of purchases are expected to be made online by the year 2026, along with ecommerce sales forecast to grow over 10% this year.
As stiff competition in the e-commerce industry will continue in 2026, CRO (conversion rate optimization) remains the most powerful lever for boosting the company’s revenue without significant spending on campaigns. Companies like iCustomLabel.com are investing in digital performance and user experience, and the standards for a high-converting online store are growing at a fast pace. By the end of this year, every eCommerce business should have an idea about the latest CRO statistics and benchmarks to stand out in today’s competitive market and improve profitability.
What Is Conversion Rate Optimization?
Conversion Rate Optimization (CRO) is the process of increasing sales and conversions—such as buying a product, signing up for a service, submitting an inquiry, or filling out a form—to achieve marketing goals.
Here is a formula to calculate conversion rate:
If 1,000 people visit your landing page and 25 of them sign up, your conversion rate is:

Conversion optimization helps convert users into customers and reduce cart abandonment by optimizing landing pages, checkout processes, funnel mapping, and drop-off points while lowering bounce rates.
What is the Core CRO Process?
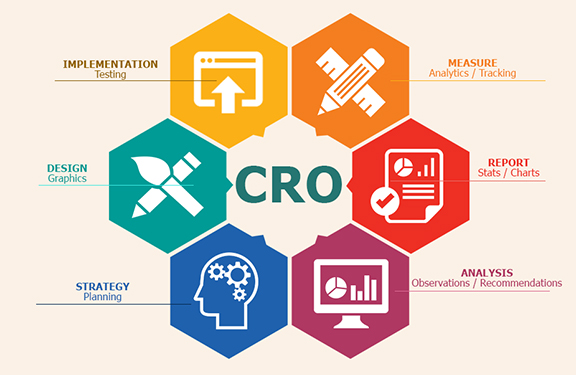
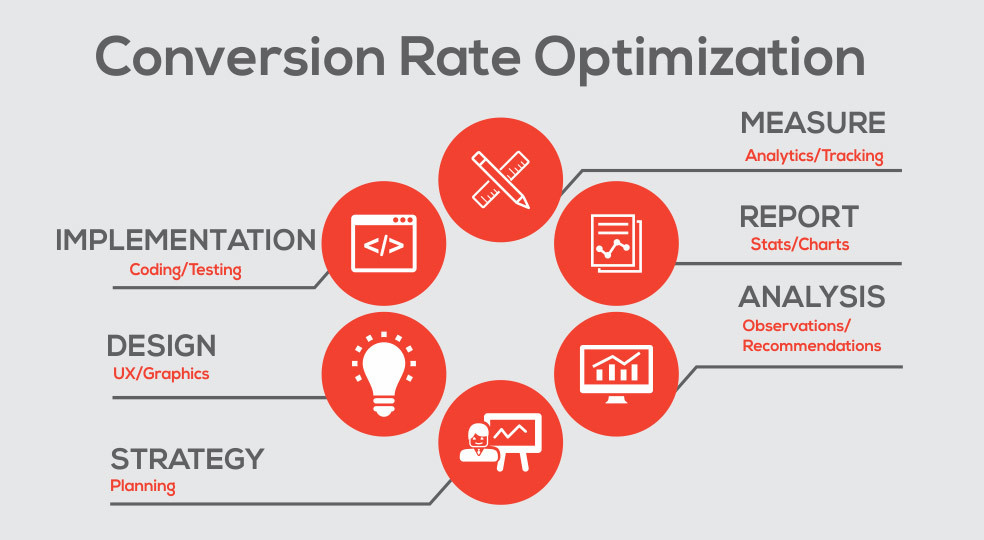
Data Analysis & Research: Collecting data from multiple sources—such as Google Analytics, heatmaps, and user surveys—to identify drop-off points, UI/UX issues, checkout friction, and other user obstacles for continuous improvement.
Improve Friction Points: Identify issues and optimize the checkout or drop-off pages where users are leaving or abandoning the website.
Testing: Testing is key to CRO success. Run A/B tests or multivariate tests by randomly splitting traffic between the original design (Control) and the updated version (Variant) to evaluate improvements and measure success before making changes permanent.
Implementation: Permanently applying the winning variant and analyzing the overall impact on revenue or leads.
Here are some typical metrics used for CRO:
- Overall conversion rate
- Add-to-cart rate
- Cart abandonment rate
- Checkout completion rate
- Revenue per visitor (RPV)
- Average order value (AOV)
What Do Average Conversion Rates Look Like?
1. Global Average E-commerce CRO – When we talk about the overall average, it is expected to remain steady in the range of 2.5% to 3.5%. However, major brands may see conversion rates ranging
from 5% to 10%.
2. Desktop vs. Tablet vs. Mobile – The gap in these devices will be continued because of the fantastic mobile experience. CRO strategies must adapt to device-specific behavior: desktop users convert highest (~3%–5%) and need rich, side-by-side content for deep research; mobile users convert lower (~1.5%–2.5%) and require speed, thumb-friendly layouts, and digital wallets; and tablet users (~2.5%–3.5%) need touch-friendly target sizes and adaptive layouts for casual, orientation-switching browsing.
• Mobile: 2% – 2.5%
• Desktop: 4% – 5%
• Tablet: 3.5% – 4.5%
3. By Industry – Conversion rates vary widely by industry depending on price, purchase complexity, and buyer intent. High-consideration sectors like B2B SaaS, higher education, and finance typically see lower conversion rates (1%–2%) due to longer research cycles and complex approvals. In contrast, fast-paced industries driven by impulse buys or immediate needs—such as e-commerce, consumer goods, and food delivery—often reach higher rates (3%–5%+) through lower price points and simpler checkouts.
• Top-Performing (above 5%): Pets, Beauty, Apparel, Home &
Garden
• Mid-Performing (3-4%): General Retail, Electronics, Food&Beverage.
• Low-Performing (1 to 2%): Luxury Goods, B2B Ecommerce, Jewelry (higher price points and longer decision cycles).
Some Main CRO Drivers and Their Insightful Statistics for 2026
Core Web Vitals & Page Speed
• A 100-millisecond delay in loading time may reduce conversion
rates by up to 7%.
• Webpages that load in one second have a conversion rate 3 times
higher than pages that load in five seconds.
• More than 60% of cart abandonment is directly attributed to poor
site performance due to crashes and slow loading.
User Experience
• Nearly 53% of mobile website visits are ignored if a page takes
time to load (more than three seconds).
• Websites with a flawed/complex checkout process have a 17%
lower conversion rate than those with a smooth one.
• Posting a video on a landing page can help you increase conversion
rates by more than 80%. In 2026, it will expand to interactive yet
passable video.
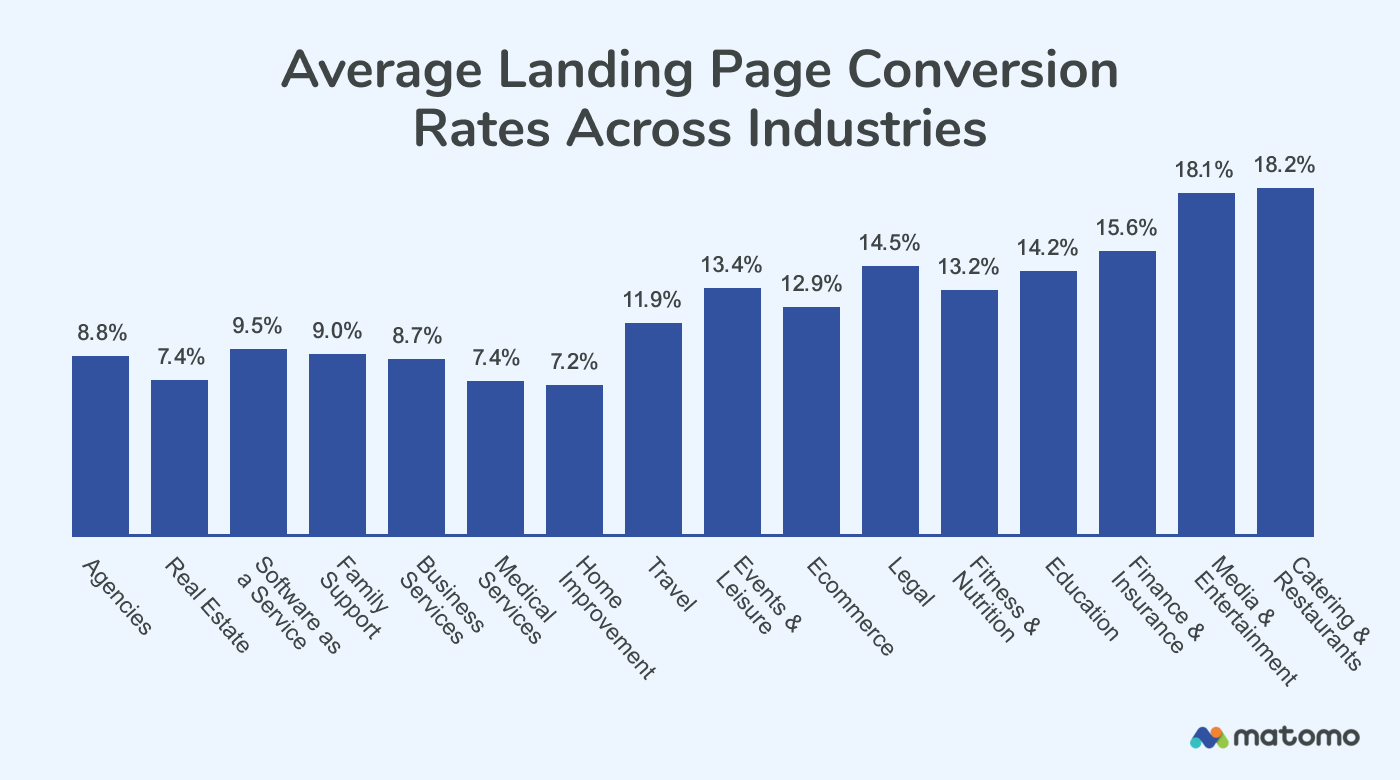
Source- matomo.org
Social Proof
• More than 88% of customers prefer to check online reviews and
also personal recommendations.
• Products with reviews convert at a rate of 3.5 times higher
conversion rate than products without them.
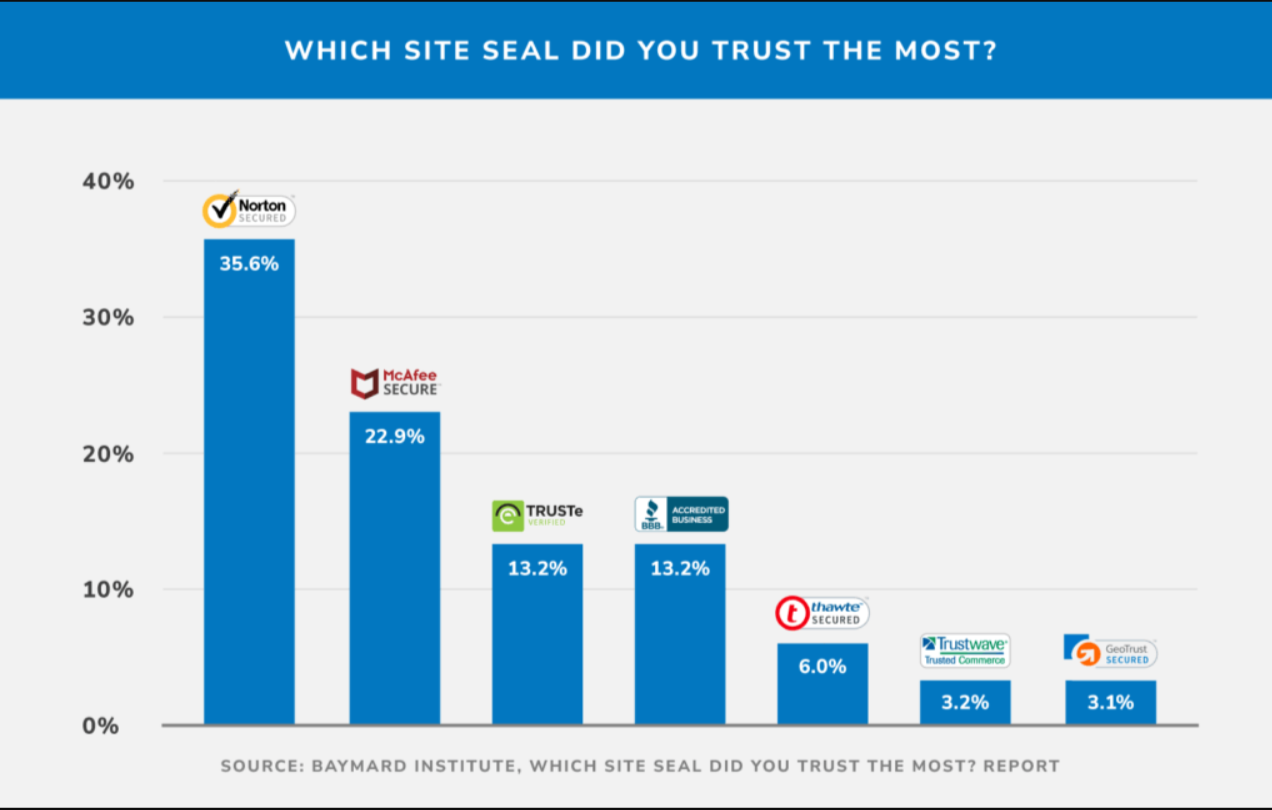
• Display trust badges, e.g., payment icons, security seals to
get conversion rates by up to 42%.
AI & Personalization
Personalization will be the single biggest differentiator in 2026.
• Around 80% of customers are more likely to make a purchase from
a brand that provides tailored experiences.
• Websites using behavioral-driven personalization (showing content
based on the real-time actions of a user) see an average of 15-20%
uplift in CRO.
• AI-powered product recommendation engines are responsible for up
to 35% of ecommerce revenue on major retail sites.
Cart Abandonment & Recovery: Reduce abandoned carts by streamlining checkouts with one-click payments and guest options. Recover lost sales using automated exit-intent popups, personalized follow-up emails, SMS reminders, and retargeting ads.
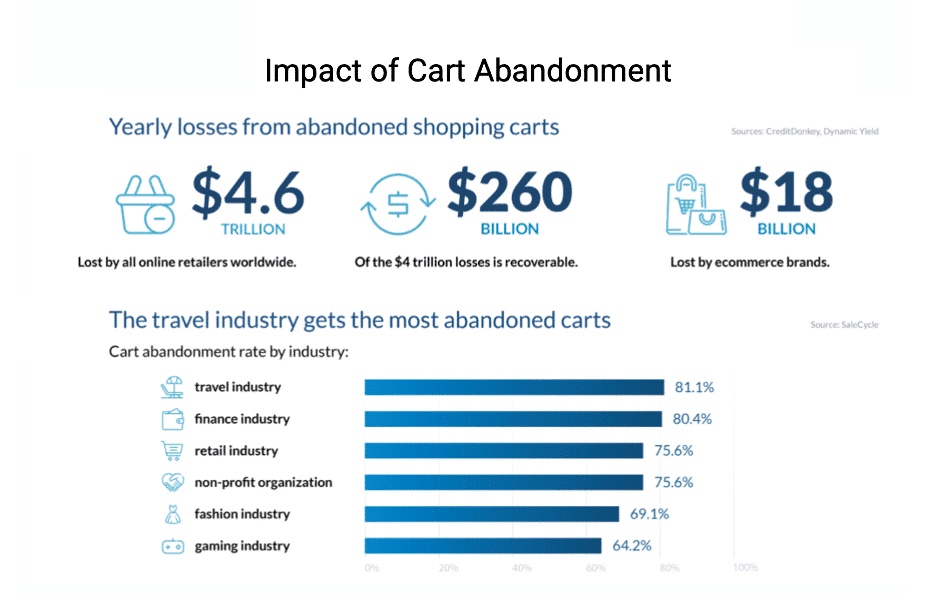
• The first cart abandonment email sent within one hour has an
average open rate of over 40% and can recover up to 20% of lost
sales.
• Implementing exit-intent popovers with a targeted offer can
decrease abandonment by 10-15%.
• The average documented online cart abandonment rate is nearly
70%.
The Rise of Visual and Voice Search
• By next year, it is expected that more than 50% of all online
searches will be conducted via image or voice.
• Companies that adopt visual search technology report that there is
a 30% increase in conversion rates for users who are engaged with
this feature, as it drastically decreases friction in finding products.
Introduction of Virtual and Augmented Reality (AR)
• Products with VR/AR experiences will see a 40% reduction in return
rates.
• Conversion rates for users who are involved with AR are up to twice as high as for those who aren’t.
Conclusion
E-commerce CRO represents a great intersection of technology, user psychology, and data science. Forward-thinking businesses stand out in the markets by adapting a proactive, customer-centric approach, leveraging immersive tech and AI. A prime focus on continuous experimentation and delivering a great customer experience will be the main considerations to achieve sustainable growth and increase conversions.
