As per Forbes, it is assumed that 24% of purchases are expected to be made online by the year 2026, along with ecommerce sales forecast to grow over 10% this year.
As stiff competition in the e-commerce industry will continue in 2026, CRO (conversion rate optimization) remains the most powerful lever for boosting the company’s revenue without significant spending on campaigns. Companies like iCustomLabel.com are investing in digital performance and user experience, and the standards for a high-converting online store are growing at a fast pace. By the end of this year, every eCommerce business should have an idea about the latest CRO statistics and benchmarks to stand out in today’s competitive market and improve profitability.
What Is Conversion Rate Optimization?
Conversion Rate Optimization (CRO) is the process of increasing sales and conversions—such as buying a product, signing up for a service, submitting an inquiry, or filling out a form—to achieve marketing goals.
Here is a formula to calculate conversion rate:
If 1,000 people visit your landing page and 25 of them sign up, your conversion rate is:

Conversion optimization helps convert users into customers and reduce cart abandonment by optimizing landing pages, checkout processes, funnel mapping, and drop-off points while lowering bounce rates.
What is the Core CRO Process?
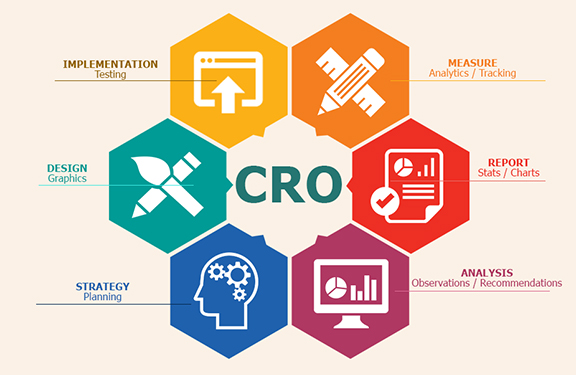
Data Analysis & Research: Collecting data from multiple sources—such as Google Analytics, heatmaps, and user surveys—to identify drop-off points, UI/UX issues, checkout friction, and other user obstacles for continuous improvement.
Improve Friction Points: Identify issues and optimize the checkout or drop-off pages where users are leaving or abandoning the website.
Testing: Testing is key to CRO success. Run A/B tests or multivariate tests by randomly splitting traffic between the original design (Control) and the updated version (Variant) to evaluate improvements and measure success before making changes permanent.
Implementation: Permanently applying the winning variant and analyzing the overall impact on revenue or leads.
Here are some typical metrics used for CRO:
- Overall conversion rate
- Add-to-cart rate
- Cart abandonment rate
- Checkout completion rate
- Revenue per visitor (RPV)
- Average order value (AOV)
What Do Average Conversion Rates Look Like?
1. Global Average E-commerce CRO – When we talk about the overall average, it is expected to remain steady in the range of 2.5% to 3.5%. However, major brands may see conversion rates ranging
from 5% to 10%.