
Do you often irritate with the way a webpage you want to visit takes too much time to open? With the global increase in bandwidth today, people are enjoying fast internet connection and are able to download large sizes of data files in relatively lesser time. However, the tolerance level towards loading pages is also plunging. So the issue of TTFB (Time to First Byte) is increasingly becoming crucial.
In this post we will delve into the concept of TTFB; how it affects you; how to measure it, reduce it or optimize it using various tools and techniques.
What is TTFB?
Simply put, “time to first byte” is a key metric that determines the responsiveness of a web server. That is, it tells you the time taken in creating a connection to the server and downloading the contents of a webpage.
When your browser tries to establish a connection to a web server, it has to go through the following steps:
- DNS Lookup
- Initial Connection
- Waiting
- Receiving Data
- Closing Connection
So clearly, the TTFB has three important components:
- Time needed to process request through the network to the web server
- Time needed for web server to process he request and generate the response
- Time needed for the server to send back the first byte of the response to the browser
Reasons for slow TTFB
- Network latency
- Amount of traffic
- Inefficient code on the origin server
- Database design resulting in slow queries
- Time taken by the website’s backend to generate the content
- Misconfigured web server
- The origin server has reached its capacity
How important is TTFB?
TTFB helps you figure out where the slow part of your website is coming from. Similarly, enterprises also use TTFB to identify weak points in the connection process. Thus, by determining where delays occur, you can tweak your services to perform faster and more reliably.
A website that has higher TTFB can disappoint its visitors; so if your webserver is taking too long to send the first, whoever might be blamed for, two issues can arise:
- Your website’s visitor will abandon the site, and visit your competitor’s instead
- Your SERP ranking can suffer since Google also takes TTFB into consideration (a study conducted by Moz correlates SERP and TTFB)
In a typical internet connection, a server has to perform a few important processes in order to produce markup before sending a request back. Let us understand using two scenarios – static content and dynamic content. To put it simply, in case of static content, a server simply returns a file without any rendering. That is to say, the content is delivered to an end user without having to be generated, modified or processed. In dynamic content, on the other hand, the server uses a composition process, known as rendering. It means examining the request route, querystring, headers, cookies, and building the response. This is the reason why dynamic content often takes longer to return as compared to static.
What are good and bad TTFB figures?
Typically for static content (that already exists on the server as files), the TTFB speed should be 100ms (milli-seconds), whereas for dynamic content, 200-500ms is the standard speed. Google says your website’s speed should be 200ms. Further, a speed between 500ms-1s is considered less than ideal, while anything greater than 1s should be investigated.
How to measure your TTFB
There are many ways and tools with which you can test your TTFB. It should be noted, however, that different tools give slightly different results. So, you are recommended to use one at a time and stick to it for a baseline.
The following are some of the most widely used tools to measure TTFB:
- WebPageTest
WebPageTest is a highly effective tool that allows you to see where your site performance stands. It also tells you how and where you need to optimize your TTFB metric. In order to measure your TTFB speed, you just need to visit the site, select a location that fits your profile and run the test. After a few moments, you will see result in “Waterfall View”; somewhat like the following:

In the above particular test, the blue part indicates downloaded content, while green area indicates the time to first byte, which is 313ms here. According to WebPageTest, the target time is the time needed for the DNS, Socket, and SSL negotiations, which is +100ms.
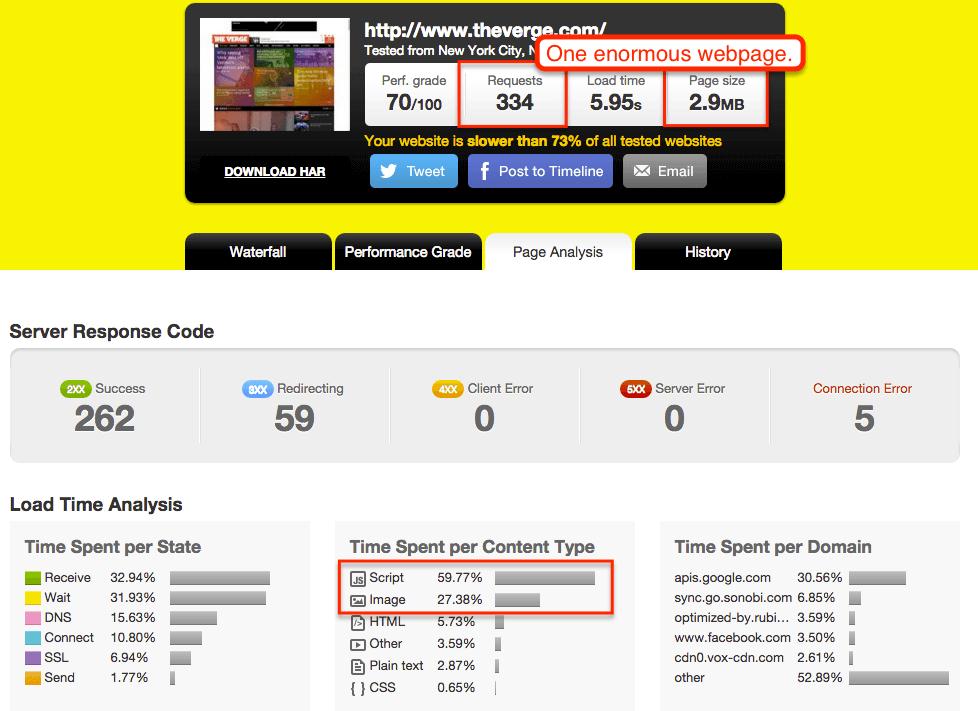
- Pingdom
Pingdom is one of the widely used website monitoring and speed testing tools currently available. Though it initially seems like a simple testing tool, but once you register with it, there is a whole gamut of features available to you. Pingdom refers TTFB to as “Wait Time”. After heading to “Pingdom Tools”, enter the URL of your website and click “Start Test”. The analysis done by Pingdom tool offers a great overview with crucial information like size analysis, size per domain, and number of requests per domain, etc. You will get the result like this:
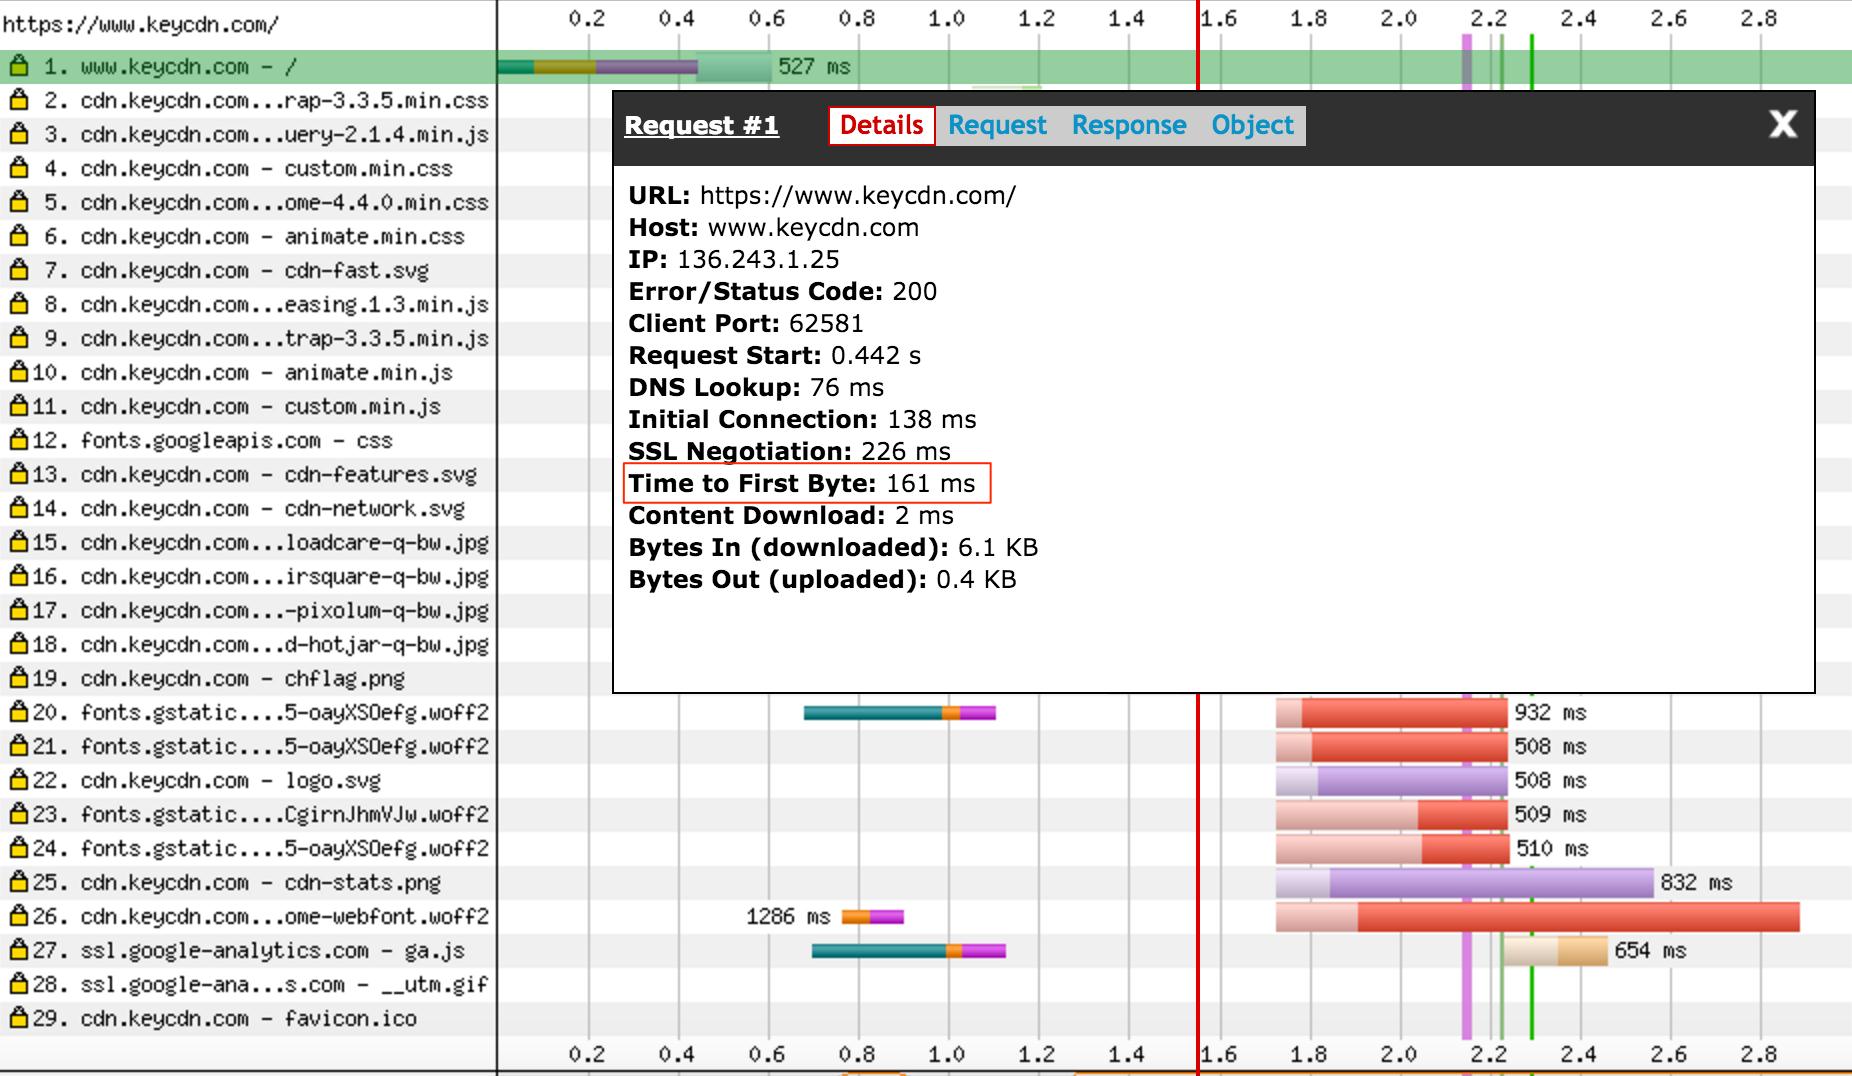
- KeyCDN Website Speed Test
KeyCDN Website speed test tool is a fast and lightweight tool that provides you with necessary details as to how your website performs. It offers 14 server locations around the world to choose from, while the speed test includes a waterfall breakdown from top to bottom. The following window displays a typical TTFB request in KeyCDN tool:
How to optimize TTFB
In this segment we will take a closer look while trying to optimize TTFB on your WordPress site. The optimization is basically done to reduce TTFB numbers in order to get better speed and results.
- Pick a fast WordPress Host
To begin with, your website’s TTFB can be greatly reduced by choosing a fast wordpress webhost. You have to make sure that you are not over-utilizing the resources that you have limited. If you are using a slower one, in that case if you start getting more traffic, you will need to upgrade your hosting sooner or later. While using WordPress, it would be better to use WordPress specific webhosting. It will help optimize for the inherent problems that come in dynamic content in general.
- WordPress theme optimizations
You have to first look at how well your web server is optimized for pulling content out of database. WordPress themes and plugins should be carefully selected as these can be two big factors for poor TTFB. Unfortunately a lot of themes and plugins are coded out of convenience without keeping server performance in-mind. So you need to use themes that are optimized for high server performance.
- WordPress server optimization
Once you’ve optimized your WordPress theme and plugins you need to take a look at the back-end configuration on your server. Then you need to check PHP handler since WordPress is a PHP/mySQL application on the back-end.
- Optimizing PHP for WordPress
All of your Shared, Reseller, and VPS hosting packages allow for multiple versions for PHP; so it is better to use PHP 7.0+ on your WordPress website. Once it is done, you need to take a look at the PHP handler. If you’re using our VPS hosting, you need to decide the best handler for your website. You can also enable PHP-FPM (FastCGI Process Manager).
- Optimizing mySQL for WordPress
Enable/Disable weekly schedules of optimization. Apply native WordPress mySQL optimize commands on your database tables without phpMyAdmin or any manual query.
- Use a CDN
CDN or Content Delivery Network is another way of reducing TTFB. A CDN stores your files on different servers around the world, which allows visitors to see your pages much faster because they can receive files from servers closer to their physical location. CDNs are an effective solution when your users are spread around the globe. For an instance, if your visitors are located at the West Coast of the United States and you are hosting at the East Coast, A CDN will help you replicate your webpage content to multiple locations so that the visitors can easily get access to the content.
While discussing CDN, it is also pertinent to understand “Latency” here. It is the total time taken to transmit a single data packet from location to another. This means it is a measure of how far a data packet has to travel, which is why even higher bandwidth internet connection doesn’t guarantee you low TTFB figures. So latency is characterized by two factors. One, physical distance from A to B. Second, number of hops between them since internet redirects them through using routers and switches. Therefore, using a CDN can decrease your TTFB by 73%.
- Caching
A significant reduction in TTFB can be achieved in your WordPress site is by caching the dynamic pages. This step could likely be the most effective one you can use to speed up your site and free your webserver from unnecessary work. Caching your webpages makes them “pre-built”, with HTML ready to go as soon as your browser requests the pages. To this effect, WordPress plugins such as “WP Super Cache” can help you cache your dynamic pages. The plugin tracks saved dynamic pages, while serving the freshest copy possible. If you want to further know how to speed up your WordPress site, you can read the ultimate guide to boost WordPress speed and performance.
- Reduce HTTP requests
When your browser makes a request to the web server in order to fetch data, it does so using HTTP; which is a form of a request/response between a client and a server. This essentially means the more HTTP requests your page makes the slower it will load. Here are the ways with which you can reduce HTTP requests:
- Inline your Javascript (JS)
- Use CSS Sprites
- Minify your CSS and Javascript
- Reduce unnecessary third party plugins that make a large number of external requests
- Reduce the use of third party frameworks unless absolutely needed
- Combine your CSS and JS files
- Compressing your images and files
You can reduce the amount of traffic for HTTP objects by compressing images and files before they are sent. Optimus WordPress Plugin developed by KeyCDN recently focuses on the advantage of combination of lossless and lossey image compression, which you can use with any platform. By using this tool for compression, you can save 4.7KB (30%) without losses. According to Google, WebP lossless images are 26% smaller than PNGs and 25-34% smaller than JPEG images.
Optimizing Back-End Infrastructure Performance
As we have already touched the fact that TTFB figure is significantly dependent upon the time spent by the server in processing your request and generating the response, which means your backend infrastructure performance is a key factor here. For example, application codes running on the hardware like your CMS; and database queries used to generate a page, how many queries made, the amount of data that is returned, as well as the configuration of the database.
Although optimization of the backend of a website is a very wide topic, but the area specific to TTFB can be mentioned here. In view of this, you need to make sure that you have the necessary equipment to smoothly run your website. It would be better to avoid any form of “shared hosting” for your website. Shared hosting is basically a platform where your site shares the same server resources with many other sites. The problem with shared hosting is it poses a substantial risk to your website because the server processing speed is significantly impacted by the load and performance of other, unrelated websites. So, instead of shared hosting, your website will be better off by using dedicated hosting resources from your hosting provider.
Another thing you should avoid is virtual or on-demand hosting systems. The problem with such systems is that your virtual server can be suspended or paused if you have not received any traffic for a certain period of time. If that happens, any new user will have to reinitiate a “resume” activity to bring the server back for processing, which could take more time to complete. Thus, your TTFB metric will get affected.
Optimize back-end software performance
This pertains to the configuration of your application or CMS. If it is using an interpreted language like PHP or Ruby, you should find ways to decrease execution time. These languages are needed to be converted into machine understandable code, which is performed by the server. It is better if the conversion is performed once, rather than with every incoming request. This is often called “compiling” or “op-code caching”. For example, with PHP you can use software like APC to speed up execution.
Furthermore, server-side caching is a highly effective way to generate dynamic pages quickly. It can be done at different levels by different tools. Some tools cache only one kind of data, while others do caching at multiple levels. For example, W3 Total Cache is a WordPress Plug-in that performs database query caching as well as page caching. Thus, any tools or techniques you are using make sure to continually test the impact to your TTFB as you make changes.
TTFB Developer Tools
One developer tool for improving site performance or TTFB is Navigation Timing API. With this you can use the User Timing API to accurately measure the performance of a snippet of code by having access to high precision timestamps, and the Timing Resource API to collect complete timing information related to resources in a document. Navigation Timing API offers several properties that tell you about the time at which certain events happen, like the time immediately before the DNS lookup for the URL occurs. It also allows you to retrieve and analyze a detailed profile of all the network timing data for a given page.

Using the Navigation Timing API you can obtain a more detailed measure of perceived loading time as shown below:
<!doctype html>
<html>
<head>
<script>
window.addEventListener(‘load’, function() {
var now = new Date().getTime();
console.log(‘Perceived loading time (in milliseconds): ‘ + (now – performance.timing.navigationStart));
});
</script>
</head>
<body>
</body>
</html>
Backend Profiling Tools
Backend profiling tools or profilers are used to take measurements of a code for later analysis in order to check performance. With these tools, you can accumulate data (such as variable values, function calls, and events) over the time you run your application in the debugger. You can view the state of your application at different points during the execution of your code.
These are of following types:
- Valgrind: Analysis tools for detecting memory leaks, thread errors, cache usage, heap profiler, etc.Cachegrind is a cache and branch-prediction profiler. Callgrind is a call-graph generating cache and branch prediction profiler, and Massif is a heap profiler.
- gcc/gprof: The GNU gcc/g++ compiler supports performance profiling. Essentially, you need to compile and link your code with the -pg option and then run it normally.
- qmlprofiler: QML code runs in a just-in-time (JIT) compiled virtual machine, making it hard to relate results from a C++ profiler to the QML code level.
- Perf and Hotspot Profiler: Perf is a set of performance analysis tools for Linux. It uses a feature of recent Linux kernels known as performance counters.
SQL Queries and TTFB
A brand new empty website will run very fast, but as it grows and ages, you may notice some sluggishness on certain pages, particularly pages with complicated bits of functionality. If you suspect that your database might be slowing down your website, then you need to figure out where the delay is coming from. The following code is specific to PHP and mySQL, but this method could be used anywhere to any website:
function StartTimer ($what=”) {
global $MYTIMER; $MYTIMER=0; //global variable to store time
//if ($_SERVER[‘REMOTE_ADDR’] != ‘127.0.0.1’) return; //only show for my IP address
echo ‘<p style=”border:1px solid black; color: black; background: yellow;”>’;
echo “About to run <i>$what</i>. “; flush(); //output this to the browser
//$MYTIMER = microtime (true); //in PHP5 you need only this line to get the time
list ($usec, $sec) = explode (‘ ‘, microtime());
$MYTIMER = ((float) $usec + (float) $sec); //set the timer
}
function StopTimer() {
global $MYTIMER; if (!$MYTIMER) return; //no timer has been started
list ($usec, $sec) = explode (‘ ‘, microtime()); //get the current time
$MYTIMER = ((float) $usec + (float) $sec) – $MYTIMER; //the time taken in milliseconds
echo ‘Took ‘ . number_format ($MYTIMER, 4) . ‘ seconds.</p>’; flush();
}
This is very useful if you are doing this (temporarily) on a live website.
Summary
TTFB is the time taken by a web browser to connect to the server and getting a response from there, which depends upon many factors – latency, traffic, database design and coding, and configuration.
TTFB is important because it can help you pinpoint where actually the connection problem is. Ideally, TTFB figure should be around 200ms, but not greater than 1s. There are many ways to measure TTFB, such as, WebPageTest, Pingdom, KeyCDN website speed test etc.
We also discussed ways of optimizing TTFB for a WordPress website. These methods are: a fast WP host, use of CDN, caching, reducing HTTP request, and compressing images and files. There are more ways of optimizing TTFB, we have only covered five here.
We took a glance in optimizing backend infrastructure performance and backend software performance. Finally, we discussed about profiling tools and how DB Queries can affect TTFB.